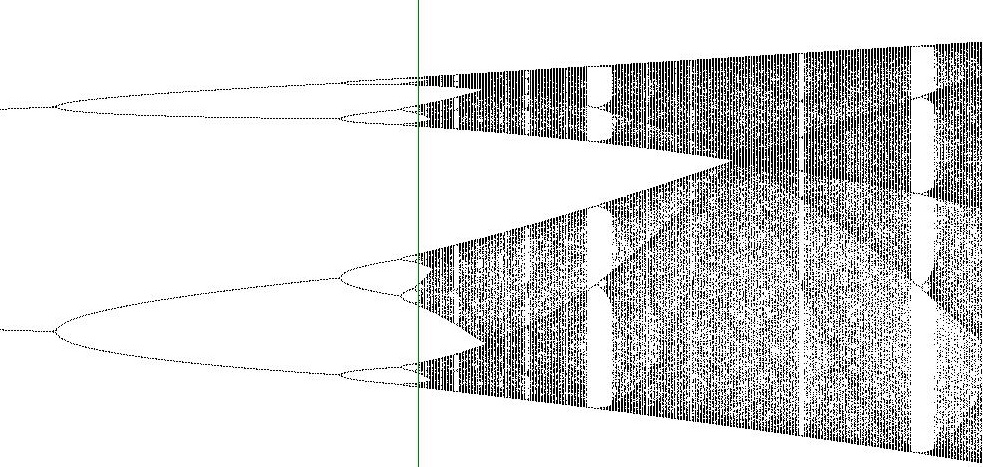
C#でロジスティク写像の分岐図を描く

X(n+1) = c * X(n) * (1.0 - X(n));
( 2 < c < 4 )
関心のある領域はカオスが現れる c=3.56994 以降なので、少し手前の 3.5 から描画。
座標の目盛を描くのは面倒だったので、c=3.569944のあたりに緑の線、周期3の領域にあるc=3.84のあたりにピンクの線を引いた。
各係数cに対して0.5 からスタートして2000回以降の600ポイント縦方向にピクセルを黒く塗りつぶす。2000回くらい反復させれば、だいたい落ち着くだろうし、カオス的であっても600ものピクセルを塗りつぶせば雰囲気はつかめるだろうと考えてのことで、回数については理論的な根拠はなし。
描画とともにファイル名決め打ち"digram.jpg"でイメージを保存して、フォトビューアなどのアプリケーションで拡大することにした。単に雰囲気を楽しみたいという動機なので、数値も埋め込みの手抜きです。
using System;
using System.Collections.Generic;
using System.Linq;
using System.Threading.Tasks;
using System.Windows.Forms;

using System.Data;
using System.Drawing;
using System.Drawing.Imaging;
using System.Text;

namespace BifurcationDiagram1
{
    public partial class Form1 : Form
    {
        double coef=4.0;
        double offset_x = 3.5; // start from 3.x
        int imax = 7000, jmax = 3500;
        int numdiv;// <= imax
        public double pixelunit_x, pixelunit_y, dc;
	string imgfile;

        private System.ComponentModel.IContainer components = null;

        protected override void Dispose(bool disposing)
        {
            if (disposing && (components != null))
            {
                components.Dispose();
            }
            base.Dispose(disposing);
        }

        private void InitializeComponent()
        {
            this.panel1 = new System.Windows.Forms.Panel();
            this.pictureBox1 = new System.Windows.Forms.PictureBox();
            this.panel1.SuspendLayout();
            ((System.ComponentModel.ISupportInitialize)

(this.pictureBox1)).BeginInit();
            this.SuspendLayout();
            //
            // panel1
            //
            this.panel1.AutoScroll = true;
            this.panel1.Controls.Add(this.pictureBox1);
            this.panel1.Dock = System.Windows.Forms.DockStyle.Fill;
            this.panel1.Location = new System.Drawing.Point(0, 0);
            this.panel1.Name = "panel1";
            this.panel1.Size = new System.Drawing.Size(1795, 925);
            this.panel1.TabIndex = 0;
            //
            // pictureBox1
            //
            this.pictureBox1.Location = new System.Drawing.Point(21, 21);
            this.pictureBox1.Name = "pictureBox1";
            this.pictureBox1.Size = new System.Drawing.Size(710, 621);
            this.pictureBox1.SizeMode =

System.Windows.Forms.PictureBoxSizeMode.AutoSize;
            this.pictureBox1.TabIndex = 0;
            this.pictureBox1.TabStop = false;
            //
            // Form1
            //
            this.AutoScaleDimensions = new System.Drawing.SizeF(13F, 24F);
            this.AutoScaleMode = System.Windows.Forms.AutoScaleMode.Font;
            this.ClientSize = new System.Drawing.Size(1795, 925);
            this.Controls.Add(this.panel1);
            this.Name = "Form1";
            this.Text = "Logistic Bifurcation Diagram";
            this.panel1.ResumeLayout(false);
            this.panel1.PerformLayout();
            ((System.ComponentModel.ISupportInitialize)

(this.pictureBox1)).EndInit();
            this.ResumeLayout(false);
        }

        private System.Windows.Forms.Panel panel1;
        private System.Windows.Forms.PictureBox pictureBox1;

        double Recursive(double c,double x)
        {
            double s;
            s = c * x * (1.0 - x);
            return s;
        }

        Point Value2Pixel(double x,double y)
        {
            return new Point((int)((x-offset_x)/pixelunit_x), (int)((1.0-

y)/pixelunit_y));
        }

        public void DrawDiagram()
        {
            Point pnt;
            int i, j, n, y0;
            double co, y;
            Graphics g = Graphics.FromImage(pictureBox1.Image);
            Brush brush0 = new SolidBrush(Color.White);
            Brush brush1 = new SolidBrush(Color.Black);
            Brush brush2 = new SolidBrush(Color.Red);

            Pen pen1 = new Pen(Color.Blue);
            Pen pen2 = new Pen(Color.Yellow);
            Pen pen3 = new Pen(Color.Green);
            Pen pen4 = new Pen(Color.Pink);
            Pen pen5 = new Pen(Color.Red);

            g.FillRectangle(brush0, 0, 0, imax, jmax);
            pnt = Value2Pixel(0.0, 0.0);
            y0 = pnt.Y;
            g.DrawLine(pen1, pnt.X, pnt.Y, imax, pnt.Y);// horizontal
            g.DrawLine(pen1, pnt.X, pnt.Y, pnt.X, 0);// vertical

            n = (int)(1.0 / pixelunit_x);
            for (i = 1; i < 4;i++ )
                g.DrawLine(pen2, n*i, 0, n*i, jmax);


            for (i = 0; i <= numdiv; i++)
            {
                co = offset_x+dc*i;
                y = 0.5;
                for (j = 0; j < 2000; j++) { y = Recursive(co,y); }
                for (j = 0; j < 600; j++)
                {
                    pnt = Value2Pixel(co, y);
                    g.FillRectangle(brush1, pnt.X, pnt.Y, 1, 1);
                    y = Recursive(co, y);
                }
            }

            pnt = Value2Pixel(3.569944, 0.0);
            g.DrawLine(pen3, pnt.X, pnt.Y, pnt.X, 0);
            pnt = Value2Pixel(3.84, 0.0);
            g.DrawLine(pen4, pnt.X, pnt.Y, pnt.X, 0);

            pictureBox1.Refresh();
        }

        public Form1()
        {
            InitializeComponent();
            pictureBox1.Image = new Bitmap(imax, jmax);
            pixelunit_x = ((coef-offset_x) / (double)imax);
            pixelunit_y = (1.0 / (double)jmax);
	    imgfile = "digram.jpg";

            numdiv = imax;
            dc = (coef-offset_x) / (double)numdiv;
            DrawDiagram();
            pictureBox1.Image.Save(imgfile, ImageFormat.Jpeg);
        }
    }

    static class Program
    {
        [STAThread]
        static void Main()
        {
            Application.EnableVisualStyles();
            Application.SetCompatibleTextRenderingDefault(false);
            Application.Run(new Form1());
        }
    }
}
以上